I run Sunshine Valley Family Farm in California—45 acres split across table and wine grapes, almonds, mixed vegetables, forage, and our home base. Three years ago, our operation hit a ceiling. Rolling hills and tight headlands made multi-pass jobs slow. Fuel receipts climbed while our old tractor spent more time in the shop than in the field. Outsourcing heavy jobs helped in peak seasons, but the bills and coordination headaches kept piling up.
We made one focused change: we standardized our core field work around a 50 HP compact tractor and re-engineered task sequences. The short version? This farm efficiency transformation shifted daily capacity from 2–3 acres to 5–8, cut fuel per acre by about 40%, dropped weekly labor by 20–25 hours, and delivered payback in roughly 24–30 months—all while improving predictability across grapes, almonds, and vegetables.
Daily capacity moved from 2–3 acres to 5–8 acres—a 150%+ swing that sustained through three seasons.
Fuel per acre fell from 1.1–1.3 gal/acre to 0.65–0.75 gal/acre, driven by right-sized power and fewer non-productive passes.
Weekly labor hours dropped from 55–65 to 35–45, thanks to faster implement changes and better sequencing.
Annual maintenance spend shrank by ≈$1,000 as we shifted to planned service instead of emergency repairs.
Payback landed at ~24–30 months. Sensitivity depends on fuel prices, labor rates, and task mix.
The Initial Challenges
Our bottlenecks were classic for small farm management on specialty crops:
Vineyard rows with narrow turn spaces meant awkward maneuvering. The old tractor’s footprint and steering made headlands a time sink.
Bed prep in vegetable blocks involved multiple machines or contractor coordination: till, form beds, lay drip, sometimes rework compacted spots after irrigation.
Almond borders and access roads needed regular edging and mowing; equipment swaps lost hours per week.
Repairs and unplanned downtime undermined agricultural productivity. The older drivetrain and hydraulics demanded frequent attention, and parts lag stretched jobs over multiple days.
Across the 15 acres of grapes, 10 acres of almonds, and 10 acres of mixed vegetables, our pass counts were high and our sequences fragmented. Fuel use sat in the 1.1–1.3 gal/acre range with too much idle and overlap. The result was inconsistent throughput—and costly outsourcing when schedules collided.
Farm Efficiency Transformation: The Solution with a 50 HP Compact Tractor
Disclosure: QILU is our product. We selected a 50 HP compact in the QL-504 series because it fits vineyards and orchards: tight turning, adequate PTO speeds for implements, and hydraulic capacity for lifters and loaders. For reliability context, see QILU’s reliability features on the QL‑504G page.
Why 50 HP for this terrain and crop mix:
Tight headlands: a compact body with full‑hydraulic steering maintains control on rolling hills.
PTO/hydraulic fit: rear hydraulic lifter and 8F+2R gearbox support bed prep, mowing, light loader work, and implement control without excessive fuel draw.
Canopy clearance: a lower profile helps under vineyard and orchard canopy edges.
In orchard‑oriented rows, the QL‑504Y‑E variant offered dual PTO options and tire setups suited to our almond blocks. We referenced the model page for specs: QL‑504Y‑E orchard variant.
The key is not the badge—it’s the match. Comparable compact 40–60 HP tractors, set up with the right implements and quick‑hitch connectors, can support similar workflows. Selection criteria we found decisive:
Integrated spray calibration guidelines from local extension materials to minimize rework passes.
Benchmarked field capacity for each job and locked in realistic daily acre targets by block.
Measurable Results (Over 3 Years)
Here’s our first‑party data summary. Methods: we kept fuel logs per block, weekly labor sheets, and maintenance invoices; task times were clocked during key windows and averaged by operation.
Metrik
Before (old tractor + hand work + outsourcing)
After (50 HP compact + optimized sequences)
Change
Daily acres managed
2–3
5–8
+150%+
Fuel per acre
1.1–1.3 gal/acre
0.65–0.75 gal/acre
≈ −40%
Weekly labor hours
55–65
35–45
−20 to −25 hrs
Annual maintenance/repairs
$1,200–$1,800
$400–$600
≈ −$1,000/yr
Implement changeover
n/a
5–15 minutes
Faster task switching
Till 1 acre vegetables
~3 h
~1.5 h
−50%
Move 10 tons fertilizer
~2 days
~4 h
−70%+
Trim 5 acres orchard edges
~1.5 days
~0.5 day
−~67%
To cross‑check why these shifts are reasonable, we used field capacity logic common in extension guidance: effective acres/hour depends on implement width, ground speed, and an efficiency factor that accounts for turning, overlap, and downtime. Iowa State’s custom rate and methodology materials outline this approach; see Iowa State’s 2024 Custom Rate Survey (A3‑10) and efficiency references summarized in the Iowa Nutrient Reduction Strategy compendium (2025). For California vineyard context on equipment passes and site layout, UC ANR’s Small Vineyard Management (2024) provides relevant planning cues.
These references don’t endorse specific brands; they explain why narrowing overlap, maintaining speed, and reducing changeover time increases agricultural productivity on specialty crops.
ROI Worked Example (Payback in ~24–30 Months)
Assumptions (local ranges; your figures will vary):
Fuel: $4.50/gal average across the period.
Labor: $15–$20/hour for farm hands (plus payroll taxes/overhead not included here).
Capital outlay: compact tractor + core implements at market rates; financing costs omitted for simplicity.
Annualized savings (from our logs):
Fuel: ≈40% reduction at prior volumes; on 500 acres of annual pass equivalents, this is material.
Maintenance: ≈$1,000/year lower spend compared to the old unit’s repair profile.
Labor: 20–25 hours/week saved during peak months (assume 30 peak weeks/year). That’s ≈600–750 hours avoided annually. At $15/hour, ≈$9,000–$11,250 potential savings; at $20/hour, ≈$12,000–$15,000.
Add conservative offsets for training time and scheduled maintenance, and the payback window we observed lands in the 24–30 month range. If fuel prices rise or labor rates increase, payback shortens; if task mix skews to less mechanizable operations, payback lengthens. This is why we emphasize a transparent, log‑based approach over universal promises.
Future Plans: Where We Go Next
Our next steps focus on precision and resilience:
Add calibrated spraying and edge‑mowing schedules that align with pest management windows and irrigation cycles.
Expand implement set gradually (bed shapers, mulchers) and keep changeover within 5–15 minutes.
Continue preventive maintenance cadence and parts staging to sustain operational cost savings.
For community exchange on sustainable small farm management, we participate in r/sustainableagriculture, where practitioners compare methods and share log‑based results.
Tanya Jawab Umum
How long did it take to see a return on investment with the QILU tractor? We reached payback in roughly 24–30 months. Your ROI depends on fuel prices, labor rates, task mix, terrain, and how consistently you apply efficient task sequencing.
Can this compact tractor handle diverse crops common in California? Yes, when configured correctly. Vineyard rows, orchard borders, and mixed vegetable beds benefit from tight turning, appropriate PTO speeds, and compatible implements. We matched implement widths and used quick‑hitch connectors to keep changeover within 5–15 minutes.
What were the biggest drivers of agricultural productivity gains? Fewer non‑productive passes, cleaner headland maneuvers, and standardized implement widths. Loader staging and sequence planning cut idle and travel time.
How did operational cost savings show up week to week? Fuel per acre dropped to 0.65–0.75 gal/acre; maintenance shifted to planned service; weekly labor fell by 20–25 hours during busy periods thanks to faster changeovers.
Any caveats or risks to this approach? Safety and training matter—operators must understand PTO speeds, hitching, and hydraulic loads. ROI varies with local costs and crop calendars. Comparable compact tractors from other reputable manufacturers can achieve similar outcomes if matched to implements and terrain.
Notes on Methods and Data Integrity
We logged fuel and labor weekly, tied entries to blocks, and kept maintenance invoices. Task timing used averaged stopwatch readings over multiple passes per season. External references support methodology (field capacity and planning) but do not validate our specific numbers; they illustrate why the observed farm efficiency transformation is achievable when you reduce overlap and changeover time.
Multimedia
YouTube case study demonstration: Educational compact‑tractor workflow video published post‑2021 (loader cycles, bed prep, implement changes). Embed a neutral educational example once selected.
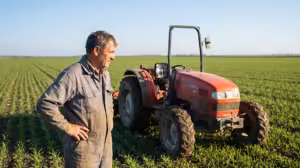
Photo 1 and Photo 2: The images above document “Old method” vs. “Using the QILU Mini Tractor” sequences to contextualize the change.
Shandong Qilu Industrial Co., Ltd. adalah produsen dan eksportir profesional yang mengintegrasikan pengembangan dan produksi ekskavator, loader, dan traktor. Kami memberikan layanan terbaik, tentu saja.


-1.png)